The Silent Tax: Why Your Google Ads Account Is Paying a 300% Inefficiency Premium
Most Google Ads operators are obsessed with ROAS. It is a fine dashboard metric. What it consistently masks is a structural inefficiency that is costing them money on every single auction they enter: the Quality Score economic engine.
Quality Score is not a gold star from Google. It is a tax mechanism built into the Ad Rank formula. Every keyword sitting at a Quality Score of 5 or 6 is paying a premium to participate in auctions that a more relevant competitor wins at lower cost. The account is not just underperforming. It is actively subsidizing the efficiency of competitors who have done the relevance work.
At scale, this premium is not marginal. The mathematical relationship between Quality Score and CPC means that moving a keyword from a score of 5 to 10 can reduce your cost for the same position by close to 50%. On a $50,000 monthly account with 30% of spend trapped in the Quality Score 5 to 6 range, that is $7,500 per month in avoidable overpayment, compounding every month the structural problem goes unaddressed.
The goal of this audit is to identify where that premium is being paid, what is causing it, and what changes will eliminate it.
For the broader campaign architecture that determines how Quality Score improvements translate into algorithmic performance, The Alignment Tax covers the post-click landing page relationship that drives the Landing Page Experience component of Quality Score.
How the Auction Tax Actually Works
To understand why Quality Score creates a cost differential, you need to understand how Google's Ad Rank formula translates into actual CPCs.
Ad Rank is calculated from three inputs: your maximum bid, your Quality Score, and the expected impact of your ad assets. The advertiser with the highest Ad Rank wins the top position. But the price they pay is not their maximum bid. It is determined by the Ad Rank of the next competitor divided by their own Quality Score, plus one cent.
The practical consequence is illustrated clearly in this comparison:
| Advertiser | Max Bid | Quality Score | Ad Rank | Actual CPC |
|---|---|---|---|---|
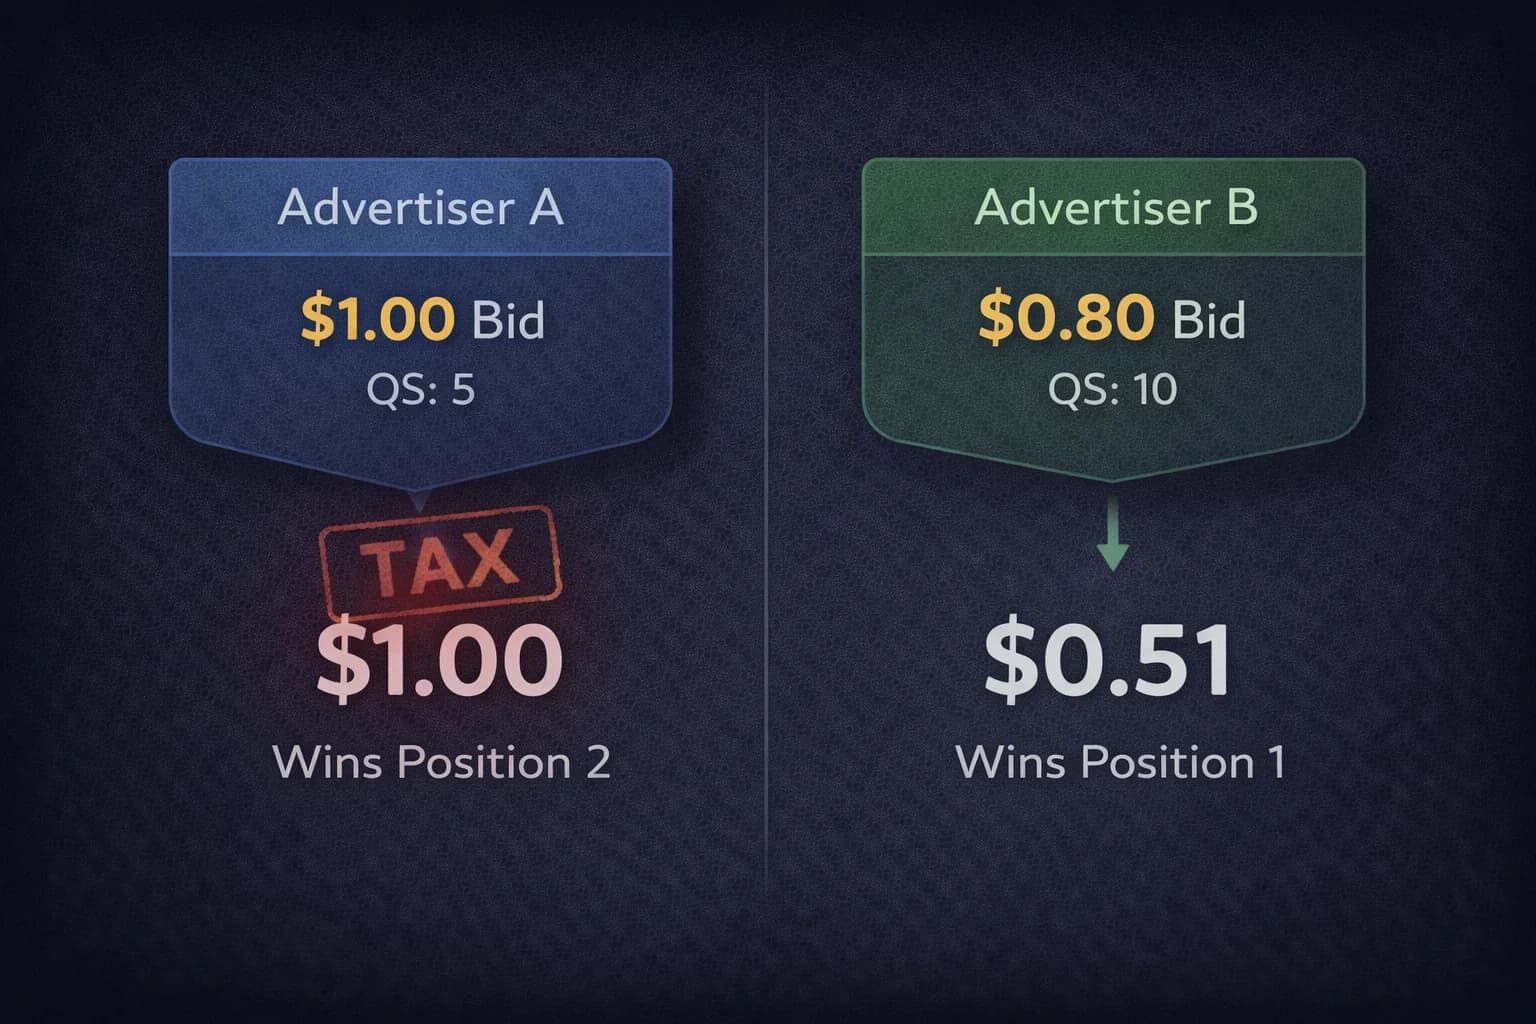
| Advertiser A | $1.00 | 5 | 5.0 | $1.00 (auction minimum) |
| Advertiser B | $0.80 | 10 | 8.0 | $0.51 |
Advertiser B wins the top position despite bidding 20% less than Advertiser A, and pays $0.51 while Advertiser A pays $1.00 for a lower position. Advertiser B's actual CPC calculation: Advertiser A's Ad Rank (5.0) divided by Advertiser B's Quality Score (10) plus one cent equals $0.51.
This is not a theoretical scenario. It is the structural reality of every auction. The advertiser with superior relevance wins better positions at lower cost. The advertiser with poor relevance pays more for worse positions. The gap between a Quality Score of 5 and 10 on a high-volume keyword, compounded across every auction that keyword enters over a month, is the Silent Tax.
Google's incentive structure explains why this exists. Relevant ads generate clicks. Clicks generate revenue for Google. The auction system rewards advertisers who produce clicks efficiently (high CTR, high Quality Score) with lower CPCs because they are contributing more value to the user experience per impression served.
The operator-level goal follows from this: concentrate at least 80% of total spend on keywords with a Quality Score of 7 or higher. Keywords in the 5 to 6 range should be in active remediation. Keywords at 4 or below should either be fixed immediately or paused until the structural problems causing their low score are addressed.
The Three Pillars: Where the Tax Is Generated
Quality Score is a composite of three independent signals. Each one is a potential leak point, and each has a different root cause and fix.
Pillar 1: Expected Click-Through Rate
Expected CTR is Google's prediction of how likely users are to click your ad when it appears for a given query, compared to other ads in the same auction. It is based on historical performance data and adjusted for factors like ad position.
A Below Average rating on Expected CTR means your ad copy is not answering the searcher's immediate need as effectively as competing ads. The user sees your ad and, based on the headline and description, does not click. Either the copy is generic, the value proposition is unclear, or you are not matching the specific emotional trigger that made the user search in the first place.
The fix is not simply writing better copy in a general sense. It is writing copy that mirrors the specific intent of the query. A user searching "enterprise cybersecurity compliance software" has a different psychological state than a user searching "affordable small business security." Generic ad copy that works for neither query specifically will be outperformed by copy that speaks precisely to either one.
Maximize SERP real estate with sitelink assets, callout assets, and structured snippets. These expand the physical footprint of your ad and give the user more surface area to find the specific element that matches their intent. A sitelink pointing directly to your compliance certification page is more relevant to the enterprise compliance searcher than a generic sitelink to your homepage.
Pillar 2: Ad Relevance
Ad Relevance measures the alignment between your keyword and your ad copy. It evaluates whether the ad actually addresses the query that triggered it.
A Below Average rating on Ad Relevance typically means theme bloat: ad groups containing too many semantically distinct keywords sharing the same creative. When a single ad group contains keywords ranging from "enterprise security" to "home alarm system," no single set of headlines can be highly relevant to both. The ad copy becomes a compromise that is mediocre for every query it serves.
The fix is Intent-Based Ad Groups that consolidate keywords around a single, specific intent cluster. Every keyword in the ad group should be addressable by the same headline and the same value proposition. When the keyword is "enterprise-grade cybersecurity," the headline must not say "Security Software." It must mirror that exact intent language. The closer the linguistic match between query and headline, the higher the Ad Relevance score.
This is where the Hagakure structure from Beyond the Default becomes relevant to Quality Score. Consolidating ad groups around landing page destinations rather than keyword granularity naturally produces tighter intent clusters, which produces higher Ad Relevance scores.
Pillar 3: Landing Page Experience
Landing Page Experience is Google's evaluation of what happens after the click. It measures whether the landing page delivers on the promise made in the ad, loads quickly, and provides a useful experience to the user.
This is the pillar most operators underinvest in because it lives outside the Google Ads interface. It also has the highest leverage in the current environment because it is the signal most directly connected to conversion rate.
A Below Average rating on Landing Page Experience means one of three problems. The page is slow (LCP above 2.5 seconds on mobile is the most common technical failure). The content does not match the ad's promise (a user who clicked an ad for "Volume Discount Pricing" and lands on a homepage about company values experiences a promise violation). Or the page architecture makes it difficult for the user to take the action the ad implied was available.
The direct connection to Quality Score is that Google's AI is evaluating the linguistic and semantic continuity between your ad copy and your landing page content. If your ad uses specific terminology that does not appear on the landing page, the system registers a relevance gap. The fix is the headline mirroring and content alignment covered in depth in The Alignment Tax: the landing page H1 should match the primary ad headline, and the body copy should reinforce the specific value proposition the ad promised.

The Audit: Finding the Budget Hijackers
Quality Score diagnosis requires looking at historical trends, not just current snapshots. A keyword's current score may reflect a temporary fluctuation or a structural collapse that has been building for months.
Step 1: Export keyword data with QS components.
Pull your keyword list with the three Quality Score components (Expected CTR, Ad Relevance, Landing Page Experience) and historical Quality Score trends. Google Ads stores up to 18 months of historical QS data.
Step 2: Filter by spend and impression share loss.
Prioritize keywords that combine high spend with high Impression Share Lost to Rank. A keyword spending $5,000 per month with 40% of its impression share lost to lower rank is a primary budget hijacker. It is spending at scale while failing to win the auctions it should be winning because a relevance gap is suppressing its Ad Rank.
Step 3: Separate temporary fluctuation from structural decay.
Use 30-day rolling averages on QS trends. A keyword that dropped from 8 to 5 last week may be recovering. A keyword that has been declining from 7 to 5 over three months has a structural relevance problem that will not self-correct.
Step 4: Apply the 80/20 liquidity test.
Calculate the percentage of your total spend allocated to keywords with a Quality Score of 5 or below. If more than 20% of spend is in this range, you have a capital efficiency problem. That spend is paying the tax premium on every auction, and the budget recovered from bringing those keywords into the 7-plus range is available for scaling high-converting queries.
The Broad Match Paradox: Quality Score in an Automated Environment
In the current landscape dominated by broad match and Smart Bidding, Quality Score can feel unstable. Broad match expands your keyword into query territory you did not explicitly choose, and those additional queries may have lower CTRs than your core terms, which can suppress your historical Expected CTR signal.
The fix is not necessarily tighter match types. It is better signals at every stage of the user journey.
Dynamic Text Replacement addresses the landing page relevance problem at scale. When broad match matches your keyword to a query you did not anticipate, the landing page headline updates dynamically to match that query's language rather than defaulting to the static headline you wrote for a different intent. This maintains Landing Page Experience scores across a wide range of broad match queries that would otherwise land on mismatched content.
Aggressive negative keyword management protects your historical CTR signal. High-impression, low-click queries reduce your Expected CTR rolling average. Every irrelevant query that generates an impression without a click degrades the signal. Removing those queries through negative keywords preserves the quality of the CTR data the algorithm uses to evaluate your Expected CTR score. This is the Quality Score dimension of the waste management covered in The Silent Bleed.
The landing page as an AI signal matters beyond just user experience. Google's AI evaluates the content of your landing page as part of its relevance assessment. A page that delivers exactly what the ad promises with the same terminology and the same level of specificity maintains the relevance signal that broad match would otherwise dilute. A generic page that provides no specific signal to the algorithm about what intent it is serving will produce declining Landing Page Experience scores as broad match expands your query footprint.
When to Ignore the Score
Quality Score is a check engine light. It indicates a potential problem. It does not mean the car has stopped running.
There are legitimate cases where a keyword operates at a Quality Score of 5 or 6 while delivering acceptable CPA and ROAS. Perhaps the keyword is in a highly competitive vertical where no advertiser achieves high relevance scores. Perhaps the query volume is low enough that the historical CTR data is statistically thin and the score is unreliable.
In these cases, do not fix the Quality Score cosmetically if the fix would hurt conversion performance. Adding aggressive copy that raises CTR but attracts mismatched clicks is worse than a lower Quality Score with higher conversion rate on the clicks that do come through.
The correct diagnostic question is not "is this Quality Score too low?" It is "is this Quality Score generating a CPC premium that, if eliminated, would produce more net revenue at the same budget?" If the answer is yes, fix the relevance. If the answer is no, or if the fix would require compromising conversion rate, the current configuration may be acceptable despite the lower score.
The Quality Score is a diagnostic for the auction. It is not your business KPI. Treat it as a signal that points toward a problem worth investigating, not as a target to optimize in isolation.
The Compounding Return on Relevance
The financial case for Quality Score remediation is not just the immediate CPC reduction. It is the compounding return on every improvement.
A keyword brought from Quality Score 5 to 8 pays less per click. Lower CPC means the same budget buys more clicks. More clicks produce more conversion data. More conversion data improves Smart Bidding accuracy. Better Smart Bidding finds higher-quality clicks. Higher-quality clicks produce better CTR signals. Better CTR signals maintain or improve the Quality Score. The cycle compounds.
Conversely, a keyword stuck at Quality Score 5 pays more per click. Higher CPC buys fewer clicks. Fewer clicks produce less conversion data. Less conversion data degrades Smart Bidding accuracy. The cycle erodes.
The gap between these two trajectories widens with every dollar spent. The operators who address Quality Score as a structural priority rather than a diagnostic afterthought are building a compounding efficiency advantage that pure bid management cannot overcome.
Frequently Asked Questions
What is Quality Score in Google Ads and why does it matter? Quality Score is a 1 to 10 diagnostic rating that reflects how relevant and useful Google considers your ad, keywords, and landing page to be for users. It directly affects your Ad Rank and CPC. A higher Quality Score means you pay less per click for the same ad position. A lower Quality Score means you pay more. The spread between a score of 5 and 10 can reduce CPC by close to 50% for the same position. At scale, this differential compounds into significant monthly overpayment for low-score keywords.
What are the three components of Google Ads Quality Score? Quality Score is composed of Expected Click-Through Rate (how likely users are to click your ad compared to competitors), Ad Relevance (how closely your ad copy matches the intent of the keyword that triggered it), and Landing Page Experience (how well your landing page delivers on the ad's promise in terms of content relevance, load speed, and usability). Each component is rated Above Average, Average, or Below Average. A Below Average rating on any component is an active drag on your Quality Score and Ad Rank.
How does Ad Rank determine what I actually pay per click? Your actual CPC is calculated as the Ad Rank of the next competitor below you divided by your Quality Score, plus one cent. This means that a higher Quality Score reduces your CPC even when your Ad Rank is sufficient to win the position. A competitor bidding more than you but with lower Quality Score will pay more per click while winning a worse position. The formula rewards relevance with lower prices, which is why improving Quality Score produces immediate cost reductions across every auction the improved keyword enters.
What causes a Below Average Landing Page Experience score? The three most common causes are slow page load speed (LCP above 2.5 seconds on mobile), content mismatch between ad copy and landing page (the page does not specifically address the promise made in the ad), and poor mobile usability. Google's AI evaluates the semantic and linguistic continuity between your ad and your landing page. If your ad uses specific terminology that does not appear on the landing page, the system registers a relevance gap. Headline mirroring, where the landing page H1 matches the primary ad headline, is the highest-impact single fix for this component.
When should I ignore a low Quality Score? When a low-scoring keyword is delivering acceptable CPA and ROAS and the fix for the Quality Score would require compromising conversion performance. Artificially increasing CTR with aggressive copy that attracts mismatched clicks is worse than maintaining a lower score with better-quality traffic. Quality Score is a diagnostic for the auction, not a business KPI. The correct question is whether the low score is generating a CPC premium that, if eliminated, would produce more net revenue at the same budget. If yes, fix it. If the fix would hurt conversion quality, leave it and monitor.
What percentage of ad spend should be on keywords with Quality Score 7 or higher? The operational target is 80% of total spend concentrated in keywords with Quality Score 7 or higher. Keywords in the 5 to 6 range should be in active remediation. Keywords at 4 or below should be paused until the structural relevance problem causing their low score is addressed. If more than 20% of your spend is in the Quality Score 5 to 6 range, you have a capital efficiency problem that is costing you on every auction those keywords enter.
Sources
- Google Ads Help — About Quality Score for Search Campaigns
- Semrush — What Is Quality Score? And How It Impacts Your Google Ads
- Optmyzr — Does Quality Score Still Matter in 2026?
- Tenscores — How Google Ads Quality Score Works Under the Hood
- Unbounce — Improve Your Quality Score From Ad to Landing Page: A Former Googler Tells All
- New Path Digital — Google Ads Quality Score Hacks: Ad Relevance, CTR, Landing Pages
- WordStream — Google Ads Benchmarks 2025: Competitive Data and Insights by Industry
- Data Feed Watch — 7 Powerful Ways to Improve Quality Score in Google Ads in 2025